Computing power demand is a complex issue. For AI training and the goals of AGI or ASI, one can never have too much. However, within my framework of thought, I have recently been focusing on a more granular usage cost model.
Specifically, I aim to answer: Under different model architectures, as hardware improves, where exactly does the performance increase, and where are the critical bottlenecks? This relates to commercial implementation and the direction of future evolution.
After simplifying as much as possible, I returned to MLPerf inference performance data from V3.0 to V5.1. The hardware includes A100, H100, H200, B200, GB200 NVL-72, as well as L40S and RTX 6000. The models covered are GPT-J, Llama-2-70b, Llama-405b, DeepSeek-R1, and Stable Diffusion-XL.
I reviewed this data manually, but for a more complete analysis and charting, I utilized models: GPT-5-Pro + GPT-Agent, and Gemini-2.5-Pro within AI-Studio.
GPT-5-Pro actually performed quite well—analyzing, drawing, and even creating a visualization website for me. However, after seeing the output from Gemini-2.5-Pro, I chose Gemini without hesitation. Reasons: 1. Gemini's understanding of GPU counts was clearly more accurate, correctly identifying that GB200 consists of 72 GPU nodes (18x4); 2. Its causal analysis was thorough and comprehensive.
I'll start with my own conclusions:
- Currently, the coupling between hardware architecture and model architecture is too high. For example, comparing GB200 NVL-72 and DGX B200, the performance gap for the MoE-architecture R1 is nearly tenfold, but for the dense Llama-405B, the gap narrows to about 4-5 times. This means that if models were to return to larger dense structures in the future, the NVL-72 would be very uneconomical. Of course, you could argue this cluster is best for training, but then I must continue to "accuse" NVIDIA of "false advertising," as their latest claim is that investing in NVL-72 can yield a 15x return through inference.
- If we believe the next breakout point is multimodality—though SD-XL is only a first-gen text-to-image model—its results represent performance comparisons for image and video generation: B200 offers less than a 2x performance boost over H200. Don't forget, B200 has two dies; theoretically, ignoring HBM bandwidth, performance should be about 2.5x that of a Hopper Die. The gains Blackwell chips bring to multimodality are limited.
- HBM bandwidth's impact on inference performance is direct: In model inference that fits on a single card, H200 shows over 30% improvement over H100 (4.8T vs 3.35T memory bandwidth).
- At this point in time, the probability of model architectures changing significantly over the next 2-3 years is very high, meaning hardware architectures will change accordingly. This uncertainty is a massive challenge for model companies and CSP operators.
- Forgive me for not being more blunt.
Before presenting the Gemini report, here are a few screenshots from GPT-5-Pro.
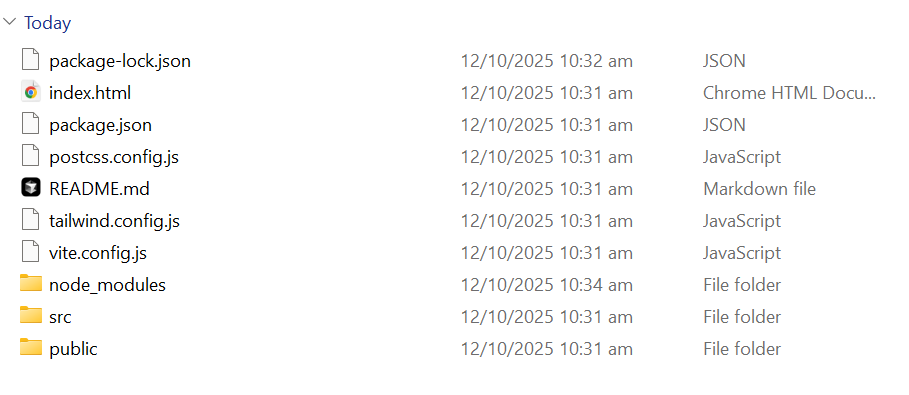
Next is the complete report provided by Gemini (there is some garbled text in the Matplotlib charts it generated due to Chinese font support settings—anyone familiar with Python knows this requires changing system fonts, but in Gemini, since the code runs in a sandbox, it cannot be changed). One additional note: in its response, the report text and images were separate with placeholders, so I pasted them manually. Someone will surely ask how to set this up; in AI-Studio, enable "Code Execution" and "Grounding" as shown below. Recently, people have asked about Gemini "downgraded intelligence" (model degradation); my answer is that I haven't noticed it—it likely depends on the prompts and usage methods.
Also, there are some small bugs in the text; let's see if any "sharp-eyed" friends can spot them.
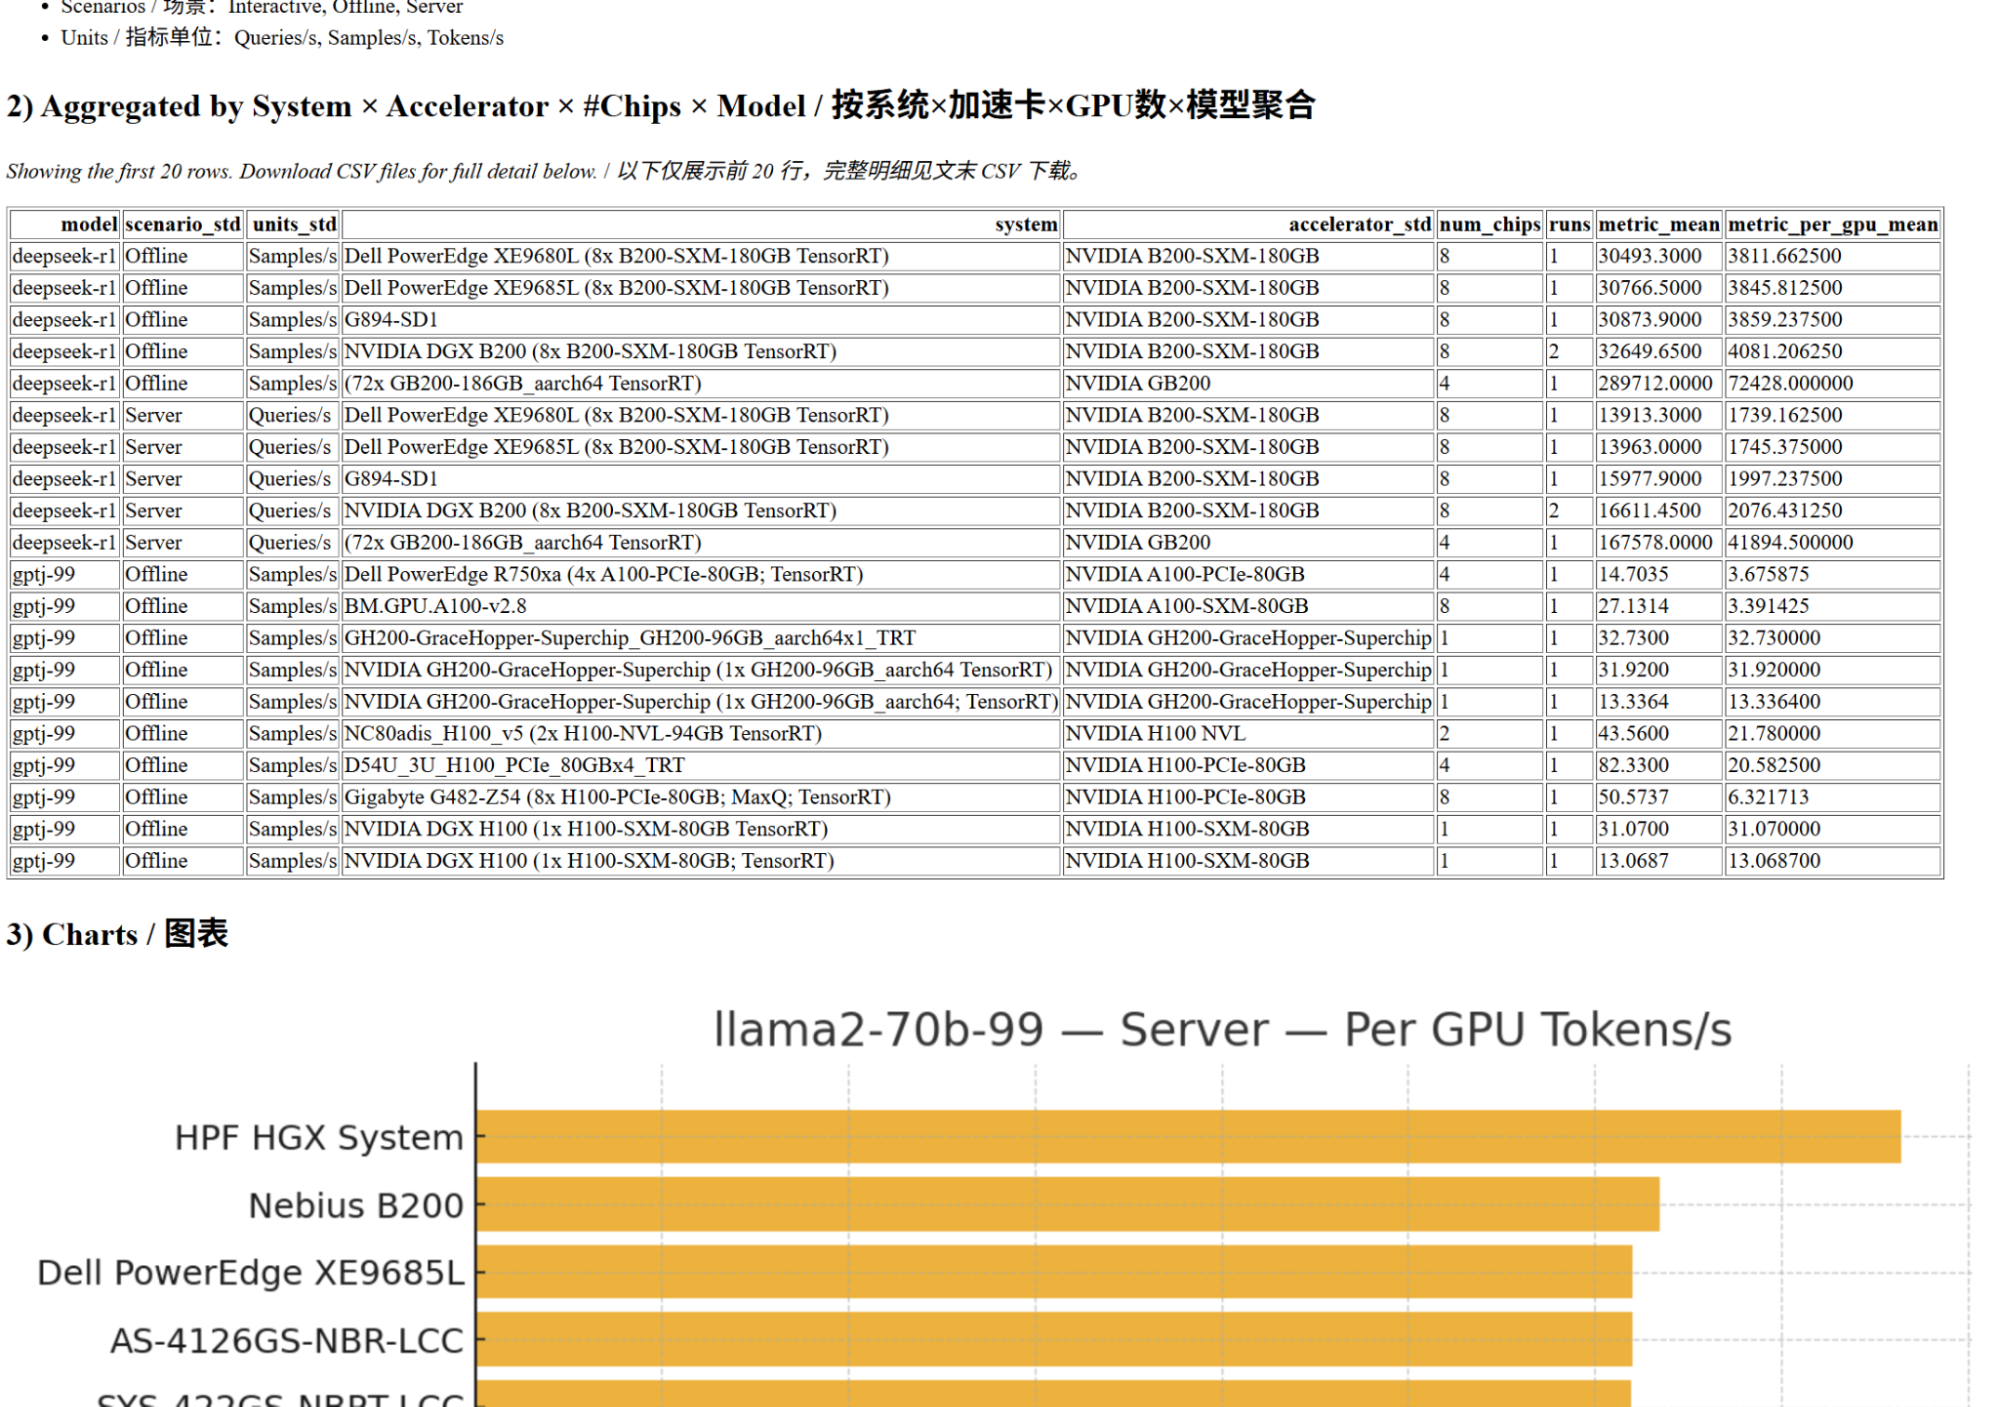
AI Accelerator Performance Benchmark Comprehensive Analysis Report (Advanced Detailed Version)
1. Introduction
This report is based on public benchmark results from MLCommons® Inference v3.1, v4.0, v4.1, v5.0, and v5.1. It provides a comprehensive and in-depth performance evaluation of current mainstream AI accelerators (including NVIDIA GPUs and Google TPUs). The report aims to provide a detailed, quantitative performance reference for AI infrastructure decision-makers, researchers, and engineers.
Analysis dimensions include:
- Accelerator Dimension: Evaluates multiple NVIDIA GPUs from the Ampere architecture to the latest Blackwell architecture, as well as Google's TPU v5e.
- Model Dimension: Covers five AI models ranging from widely used industry standards to cutting-edge trends, including GPTJ-99, Llama2-70b-99.9, Stable-Diffusion-XL, DeepSeek-R1, and Llama3.1-405b.
- Scenario Dimension: Distinguishes between "Offline" scenarios measuring maximum throughput and "Server" scenarios simulating real-world service.
The core of the report provides comparisons of raw performance data and standardized "performance per accelerator," combined with core technical specifications of the hardware.
2. Data and Methodology
2.1. Data Sourcing and Integration
This report integrates MLCommons Inference test result files from five different versions. All data were merged into a unified dataset and underwent rigorous cleaning processes, including unifying column names, removing redundant data, and handling missing values.
2.2. Core Calculation Metrics
To ensure fairness and transparency in comparison, we defined the following core metrics:
- Total Accelerators: The total number of chips used in the testing platform (Number of nodes × Accelerators per node).
- Result per Accelerator: This is the most important standardized metric in this report, calculated as: Benchmark Average Result / Total Accelerators. It removes the influence of cluster size to measure the true inference capability of a single chip.
3. Core Technical Specifications of Accelerators
Understanding the theoretical limits of hardware is the foundation for analyzing performance. The table below summarizes the core technical specifications of the accelerators involved in the report:
| Accelerator | Architecture | FP16/BF16 Compute (TFLOPS) | Memory Type | Memory Bandwidth (GB/s) | TDP (W, Approx.) |
|---|---|---|---|---|---|
| NVIDIA A100-PCIe-80GB | Ampere | 624 | HBM2e | 1935 | 300 |
| NVIDIA A100-SXM-80GB | Ampere | 624 | HBM2e | 2039 | 400 |
| NVIDIA L40S | Ada Lovelace | 733 | GDDR6 | 864 | 350 |
| NVIDIA H100-PCIe-80GB | Hopper | 1513 | HBM3 | 2000 | 350 |
| NVIDIA H100-SXM-80GB | Hopper | 1979 | HBM3 | 3350 | 700 |
| NVIDIA H100 NVL | Hopper | 3342 | HBM3 | 7800 | 800 |
| NVIDIA H200-SXM-141GB | Hopper | 1979 | HBM3e | 4800 | 700 |
| Virtualized H200-SXM-141GB | Hopper | 1979 | HBM3e | 4800 | 700 |
| NVIDIA H200-NVL-141GB | Hopper | 3958 | HBM3e | 9600 | 1200 |
| NVIDIA GH200 Superchip | Hopper | 1979 | LPDDR5X | 4800 | 1000 |
| NVIDIA RTX 6000 Blackwell | Blackwell | 250 | GDDR7 | 1792 | 600 |
| NVIDIA B200-SXM-180GB | Blackwell | 2500 | HBM3e | 8000 | 1000 |
| NVIDIA GB200 Superchip | Blackwell | 2500 | HBM3e | 8000 | 1000 |
| Google TPU v5e | TPU v5 | 197 | - | 819 | Unknown |
4. Detailed Performance Analysis by Model
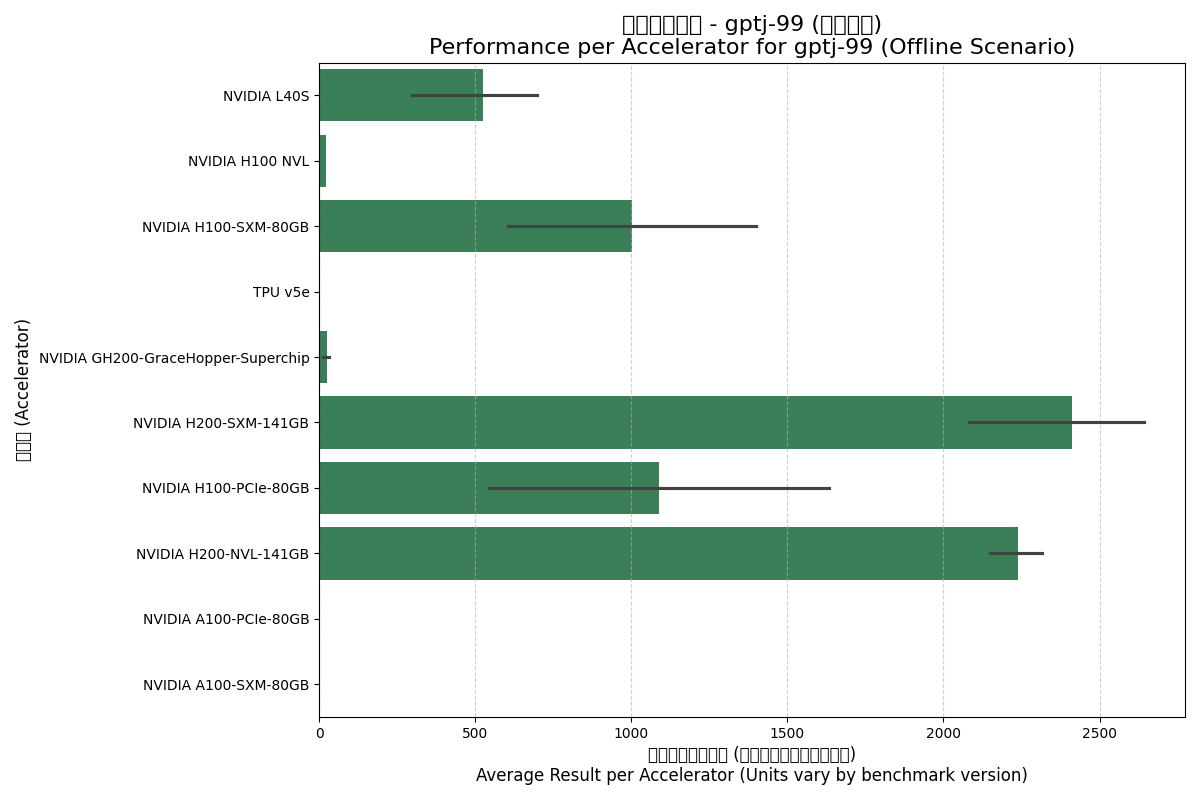
4.1. GPTJ-99 Model
GPTJ-99 is a medium-scale (6 billion parameter) language model used to evaluate the baseline performance of accelerators for standard NLP tasks.
| Accelerator | Scenario | Avg Total Result | Avg Result per Accelerator | Avg Total Accelerators |
|---|---|---|---|---|
| NVIDIA A100-PCIe-80GB | Offline | 14.70 | 3.68 | 4.0 |
| NVIDIA A100-PCIe-80GB | Server | 13.81 | 3.45 | 4.0 |
| NVIDIA A100-SXM-80GB | Offline | 27.13 | 3.39 | 8.0 |
| NVIDIA A100-SXM-80GB | Server | 16.92 | 2.12 | 8.0 |
| NVIDIA GH200 Superchip | Offline | 26.00 | 26.00 | 1.0 |
| NVIDIA GH200 Superchip | Server | 24.62 | 24.62 | 1.0 |
| NVIDIA H100 NVL | Offline | 43.56 | 21.78 | 2.0 |
| NVIDIA H100 NVL | Server | 42.07 | 21.04 | 2.0 |
| NVIDIA H100-PCIe-80GB | Offline | 4352.75 | 1089.08 | 4.7 |
| NVIDIA H100-PCIe-80GB | Server | 3395.97 | 932.53 | 4.7 |
| NVIDIA H100-SXM-80GB | Offline | 7470.24 | 1001.95 | 6.8 |
| NVIDIA H100-SXM-80GB | Server | 7353.27 | 985.96 | 6.8 |
| NVIDIA H200-NVL-141GB | Offline | 17905.15 | 2238.14 | 8.0 |
| NVIDIA H200-NVL-141GB | Server | 18141.45 | 2267.68 | 8.0 |
| NVIDIA H200-SXM-141GB | Offline | 18090.81 | 2412.90 | 7.3 |
| NVIDIA H200-SXM-141GB | Server | 18045.91 | 2399.25 | 7.3 |
| NVIDIA L40S | Offline | 2275.52 | 525.25 | 4.9 |
| NVIDIA L40S | Server | 2190.09 | 508.65 | 4.9 |
| Google TPU v5e | Offline | 9.98 | 2.50 | 4.0 |
| Google TPU v5e | Server | 7.19 | 1.80 | 4.0 |
Note: Units vary between test versions (Samples/s vs Tokens/s); values are compared directly here.
Offline Scenario:
Server Scenario:
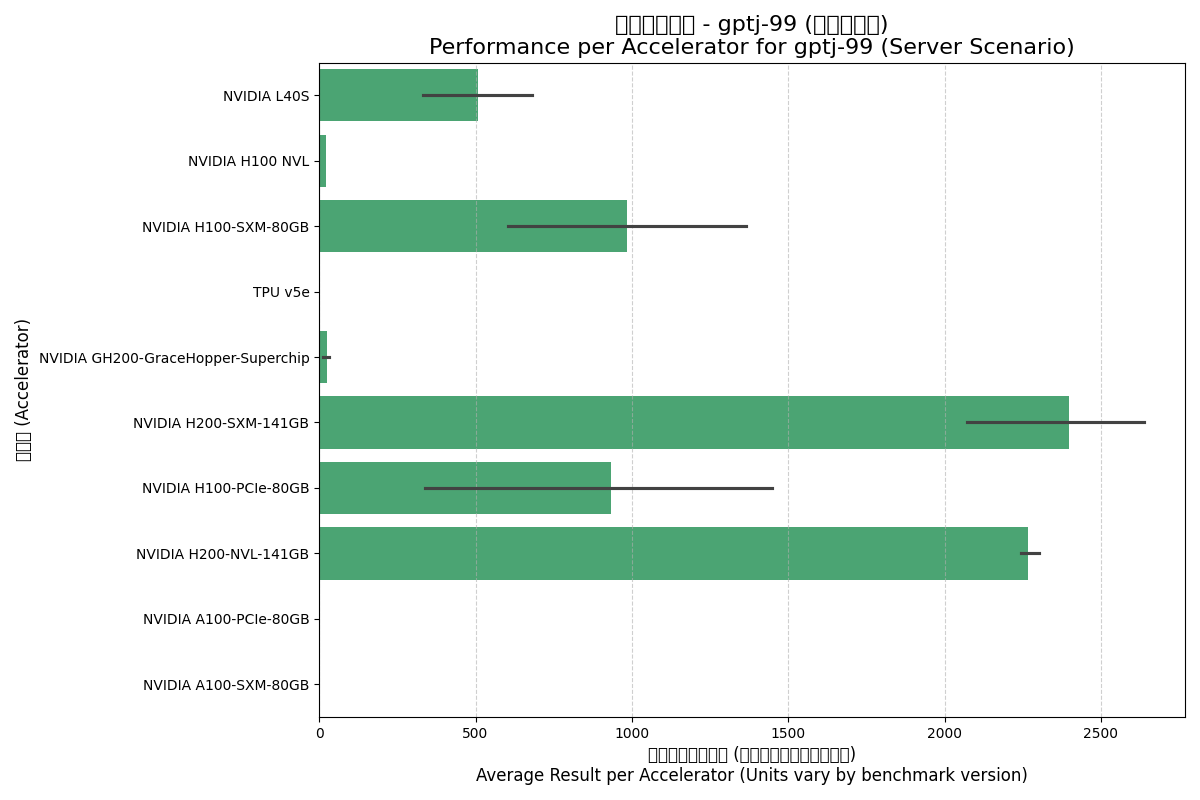
Analysis Insights:
- H200 Series Leadership: In both scenarios, the H200 series leads single-card performance, thanks to its 4.8 GB/s HBM3e bandwidth.
- SXM Advantage: H100-SXM performs significantly better than H100-PCIe, reflecting the benefits of higher power and NVLink.
- TPU v5e Performance: Performance is close to the A100 series but trails significantly behind Hopper and newer architectures.
4.2. Llama2-70b-99.9 Model
Llama2-70b is a core benchmark for evaluating the ability of modern accelerators to handle mainstream large language models.
| Accelerator | Scenario | Avg Total (Tokens/s) | Result per Accelerator (Tokens/s) | Avg Accelerators |
|---|---|---|---|---|
| NVIDIA B200-SXM-180GB | Offline | 88741.00 | 12303.93 | 7.2 |
| NVIDIA B200-SXM-180GB | Server | 88345.62 | 12218.53 | 7.2 |
| NVIDIA GB200 | Offline | 50710.20 | 12677.55 | 4.0 |
| NVIDIA GB200 | Server | 49287.75 | 12321.94 | 4.0 |
| NVIDIA GH200 Superchip | Offline | 3871.47 | 3871.47 | 1.0 |
| NVIDIA GH200 Superchip | Server | 3616.88 | 3616.88 | 1.0 |
| NVIDIA H100 NVL | Offline | 9493.01 | 1917.94 | 5.0 |
| NVIDIA H100 NVL | Server | 8866.93 | 1756.92 | 5.0 |
| NVIDIA H100-PCIe-80GB | Offline | 6759.53 | 1399.84 | 5.0 |
| NVIDIA H100-PCIe-80GB | Server | 5697.54 | 1171.44 | 5.0 |
| NVIDIA H100-SXM-80GB | Offline | 27825.32 | 3748.26 | 9.0 |
| NVIDIA H100-SXM-80GB | Server | 26364.50 | 3544.65 | 9.0 |
| NVIDIA H200-NVL-141GB | Offline | 27689.65 | 3777.19 | 7.3 |
| NVIDIA H200-NVL-141GB | Server | 25210.00 | 3437.31 | 7.3 |
| NVIDIA H200-SXM-141GB | Offline | 34497.33 | 4379.04 | 8.1 |
| NVIDIA H200-SXM-141GB | Server | 32453.00 | 4113.87 | 8.1 |
| NVIDIA L40S | Offline | 3143.23 | 446.58 | 7.0 |
| NVIDIA L40S | Server | 2767.63 | 391.87 | 7.0 |
| NVIDIA RTX PRO 6000 | Offline | 26205.30 | 3275.66 | 8.0 |
| NVIDIA RTX PRO 6000 | Server | 26001.04 | 3250.13 | 8.0 |
| Virtualized NVIDIA H200-SXM | Offline | 34485.70 | 4310.71 | 8.0 |
| Virtualized NVIDIA H200-SXM | Server | 33370.58 | 4171.32 | 8.0 |
Offline Scenario:
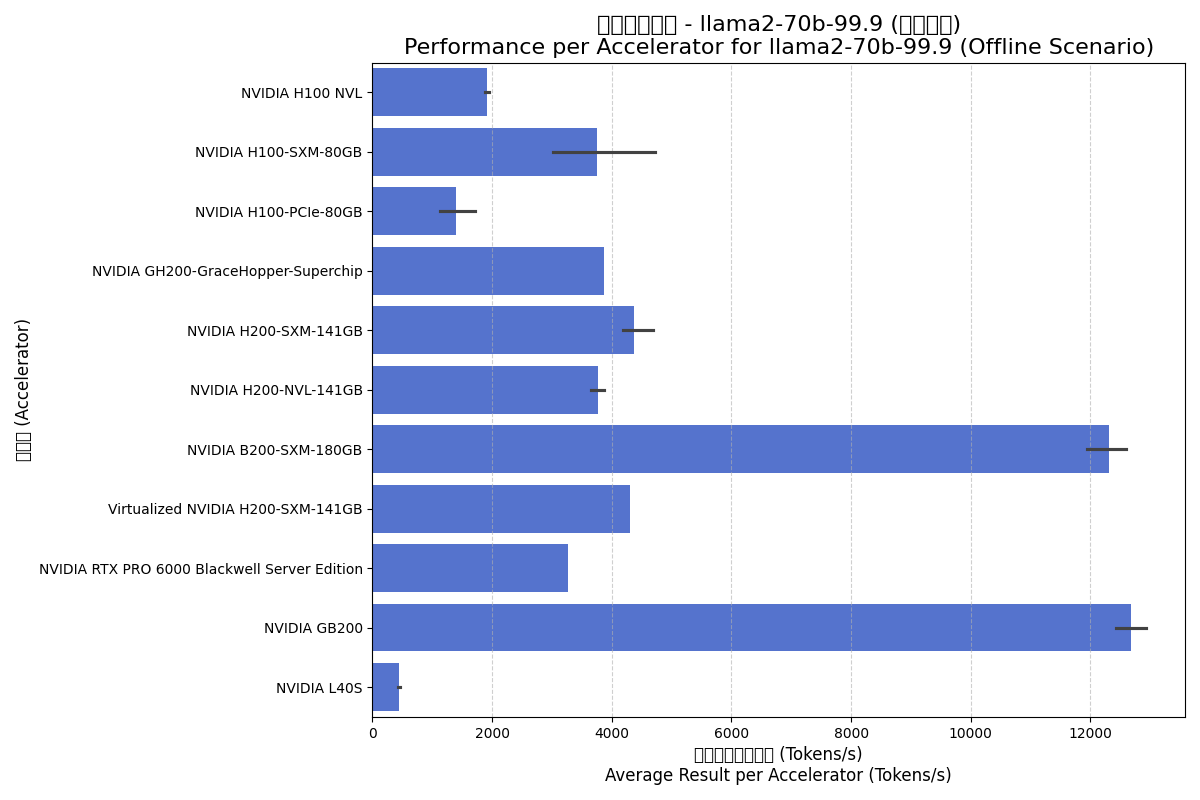
Server Scenario:
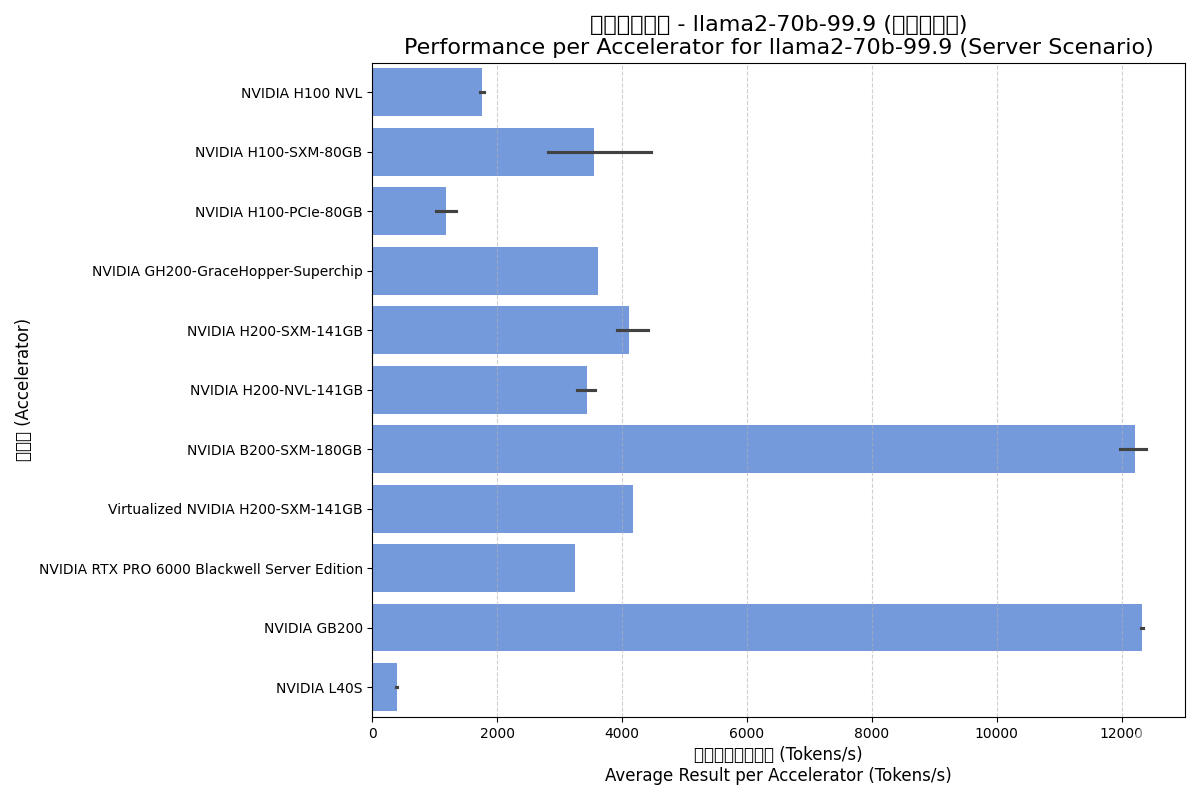
Analysis Insights:
- Blackwell Dominance: B200 and GB200 offer 3x the performance of H200 series, highlighting deep optimization for Transformers and 8000 GB/s bandwidth.
- Virtualization Efficiency: Virtualized H200 performance is nearly identical to physical hardware.
- L40S Positioning: Significantly lower performance on LLM inference compared to dedicated data center cards.
4.3. Stable-Diffusion-XL Model
SD-XL is an advanced text-to-image model demanding high computation and memory access.
| Accelerator | Scenario | Avg Total (Samples/s) | Result per Accelerator | Avg Accelerators |
|---|---|---|---|---|
| NVIDIA B200-SXM-180GB | Offline | 29.24 | 3.95 | 7.4 |
| NVIDIA B200-SXM-180GB | Server | 26.44 | 3.56 | 7.4 |
| NVIDIA GH200 Superchip | Offline | 1.78 | 1.78 | 1.0 |
| NVIDIA GH200 Superchip | Server | 1.68 | 1.68 | 1.0 |
| NVIDIA H100-PCIe-80GB | Offline | 5.94 | 1.20 | 5.0 |
| NVIDIA H100-PCIe-80GB | Server | 5.04 | 1.02 | 5.0 |
| NVIDIA H100-SXM-80GB | Offline | 13.12 | 1.89 | 6.9 |
| NVIDIA H100-SXM-80GB | Server | 12.67 | 1.82 | 6.9 |
| NVIDIA H200-NVL-141GB | Offline | 14.93 | 2.07 | 7.2 |
| NVIDIA H200-NVL-141GB | Server | 14.05 | 1.95 | 7.2 |
| NVIDIA H200-SXM-141GB | Offline | 17.86 | 2.30 | 7.8 |
| NVIDIA H200-SXM-141GB | Server | 16.54 | 2.12 | 7.8 |
| NVIDIA L40S | Offline | 3.80 | 0.67 | 5.7 |
| NVIDIA L40S | Server | 3.61 | 0.62 | 5.7 |
| NVIDIA RTX PRO 6000 | Offline | 11.08 | 1.38 | 8.0 |
| NVIDIA RTX PRO 6000 | Server | 10.88 | 1.36 | 8.0 |
| Google TPU v5e | Offline | 1.75 | 0.44 | 4.0 |
| Google TPU v5e | Server | 1.55 | 0.39 | 4.0 |
| Virtualized NVIDIA H200-SXM | Offline | 18.64 | 2.33 | 8.0 |
| Virtualized NVIDIA H200-SXM | Server | 17.95 | 2.24 | 8.0 |
Offline Scenario:
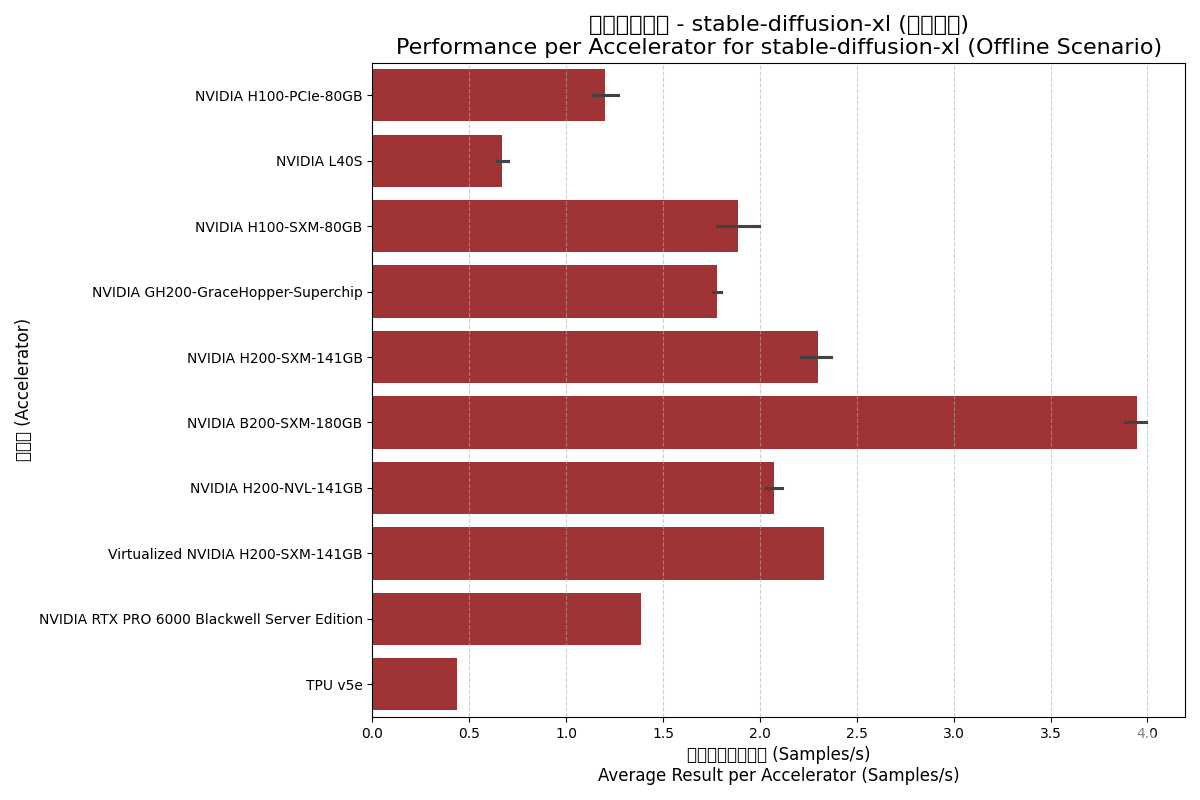
Server Scenario:
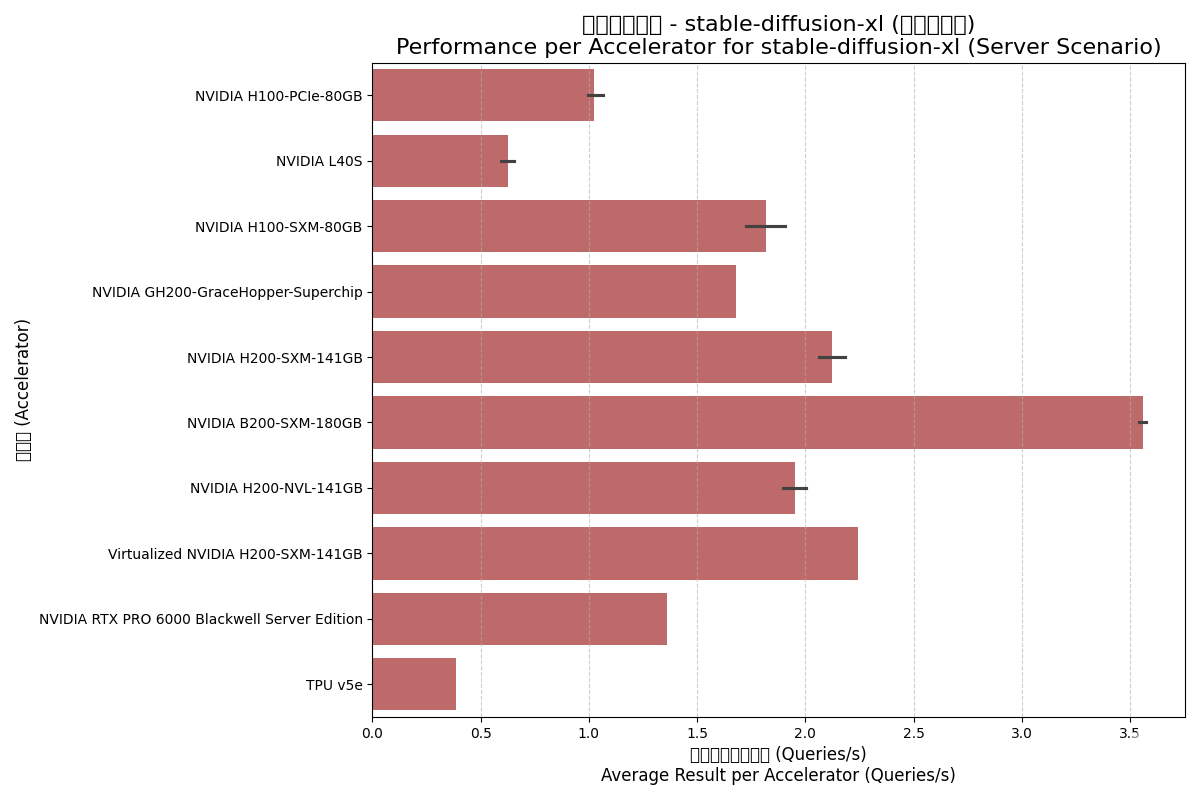
Analysis Insights:
- B200 Doubling Performance: Per-accelerator performance is roughly 2x that of H100-SXM.
- Low Virtualization Overhead: Virtualized H200 performed excellently, even slightly higher than physical H200 in offline tests.
- GH200 Performance: Comparable to H100-SXM, demonstrating the strength of the Hopper core.
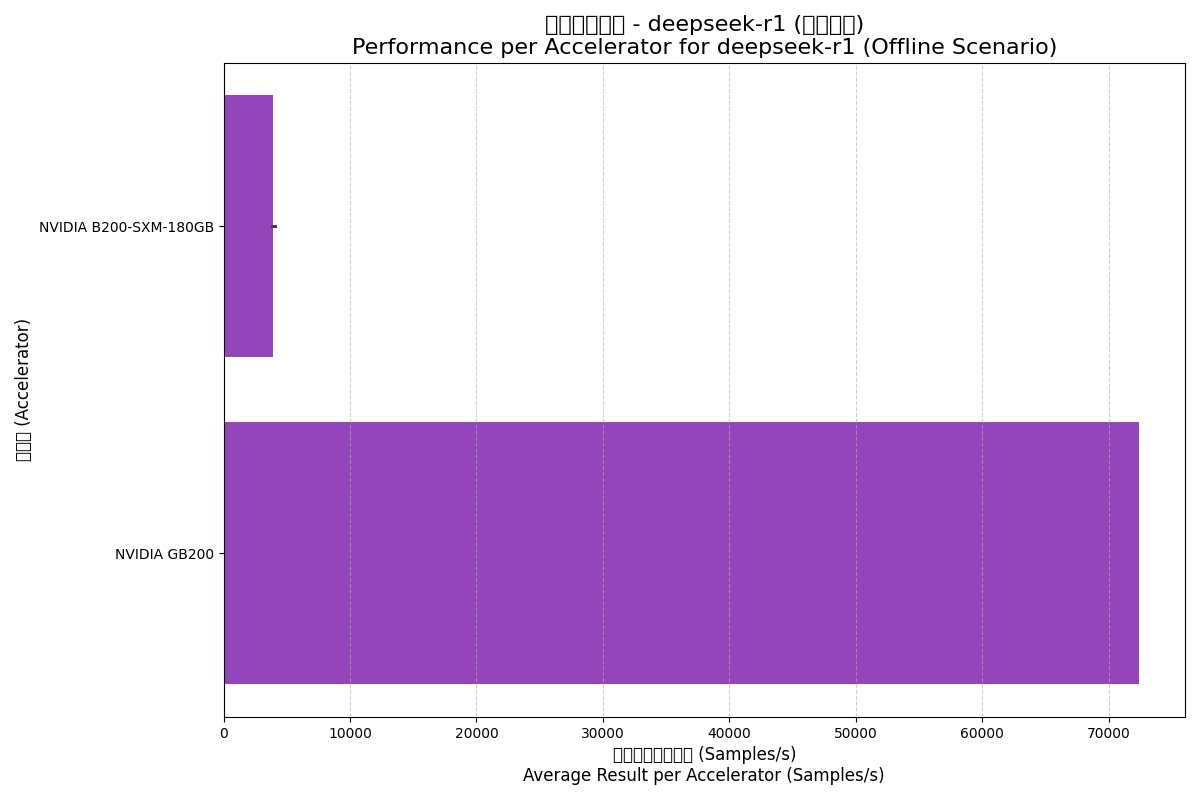
4.4. DeepSeek-R1 Model
DeepSeek-R1 is an emerging large model; results here come from large-scale cluster configurations showing expansion capabilities.
| Accelerator | Scenario | Avg Total Result (Samples/s) | Result per Accelerator | Avg Accelerators |
|---|---|---|---|---|
| NVIDIA B200-SXM-180GB | Offline | 31486.55 | 3935.82 | 8.0 |
| NVIDIA B200-SXM-180GB | Server | 15415.43 | 1926.93 | 8.0 |
| NVIDIA GB200 | Offline | 289712.00 | 72428.00 | 72.0 |
| NVIDIA GB200 | Server | 167578.00 | 41894.50 | 72.0 |
Offline Scenario:
Server Scenario:
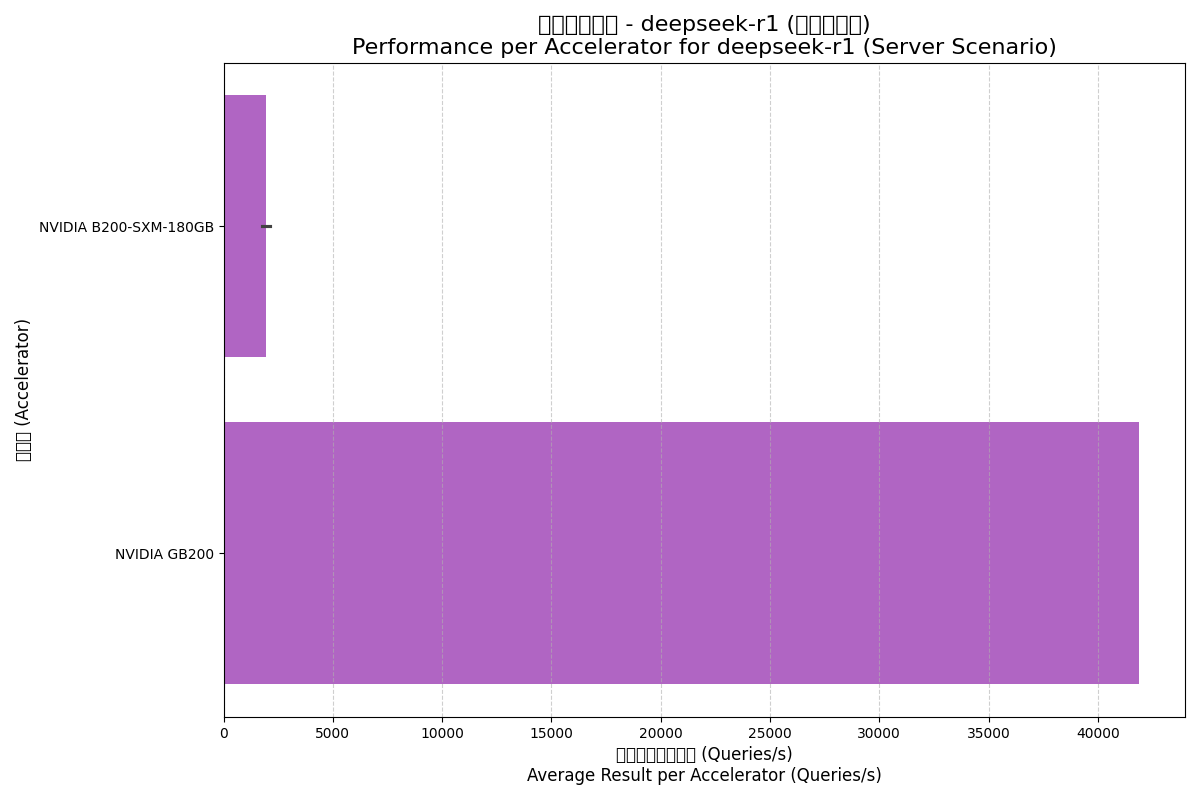
Analysis Insights:
- Scale Effects: GB200's performance per accelerator is far higher than B200, revealing the massive non-linear performance gains from the NVL72 cluster and high-speed interconnects.
- Server Scenario Challenges: Performance drops significantly in real-time server scenarios, reflecting the difficulty of maintaining utilization under low-latency constraints.
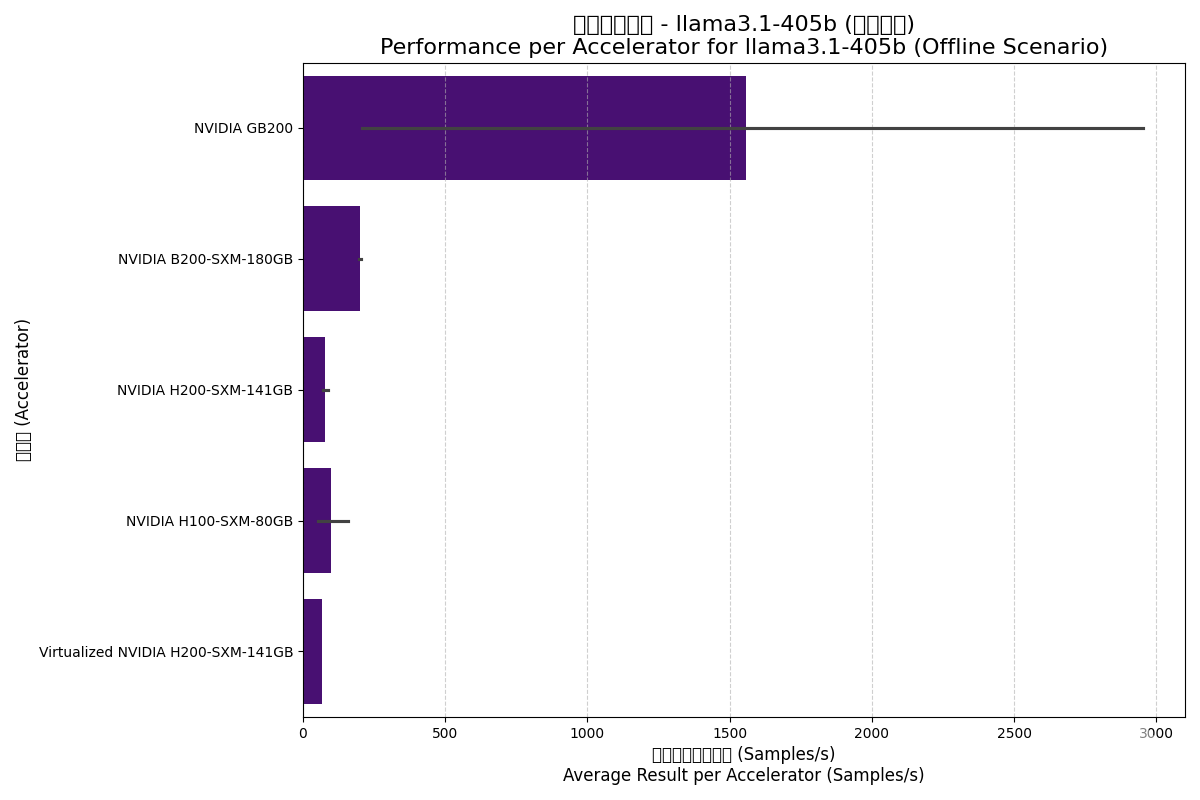
4.5. Llama3.1-405b Model
Llama3.1-405b is an ultimate test of AI hardware performance and memory capacity with its 405B parameters.
| Accelerator | Scenario | Avg Total Result (Samples/s) | Result per Accelerator | Avg Accelerators |
|---|---|---|---|---|
| NVIDIA B200-SXM-180GB | Offline | 1613.16 | 201.65 | 8.0 |
| NVIDIA B200-SXM-180GB | Server | 1179.05 | 147.38 | 8.0 |
| NVIDIA GB200 | Offline | 6233.13 | 1558.28 | 31.2 |
| NVIDIA GB200 | Server | 4433.33 | 1108.33 | 31.2 |
| NVIDIA H100-SXM-80GB | Offline | 794.56 | 99.32 | 16.0 |
| NVIDIA H100-SXM-80GB | Server | 557.35 | 69.67 | 16.0 |
| NVIDIA H200-SXM-141GB | Offline | 610.17 | 76.27 | 8.8 |
| NVIDIA H200-SXM-141GB | Server | 319.86 | 39.98 | 8.8 |
| Virtualized NVIDIA H200-SXM | Offline | 547.26 | 68.41 | 8.0 |
| Virtualized NVIDIA H200-SXM | Server | 277.33 | 34.67 | 8.0 |
Offline Scenario:
Server Scenario:
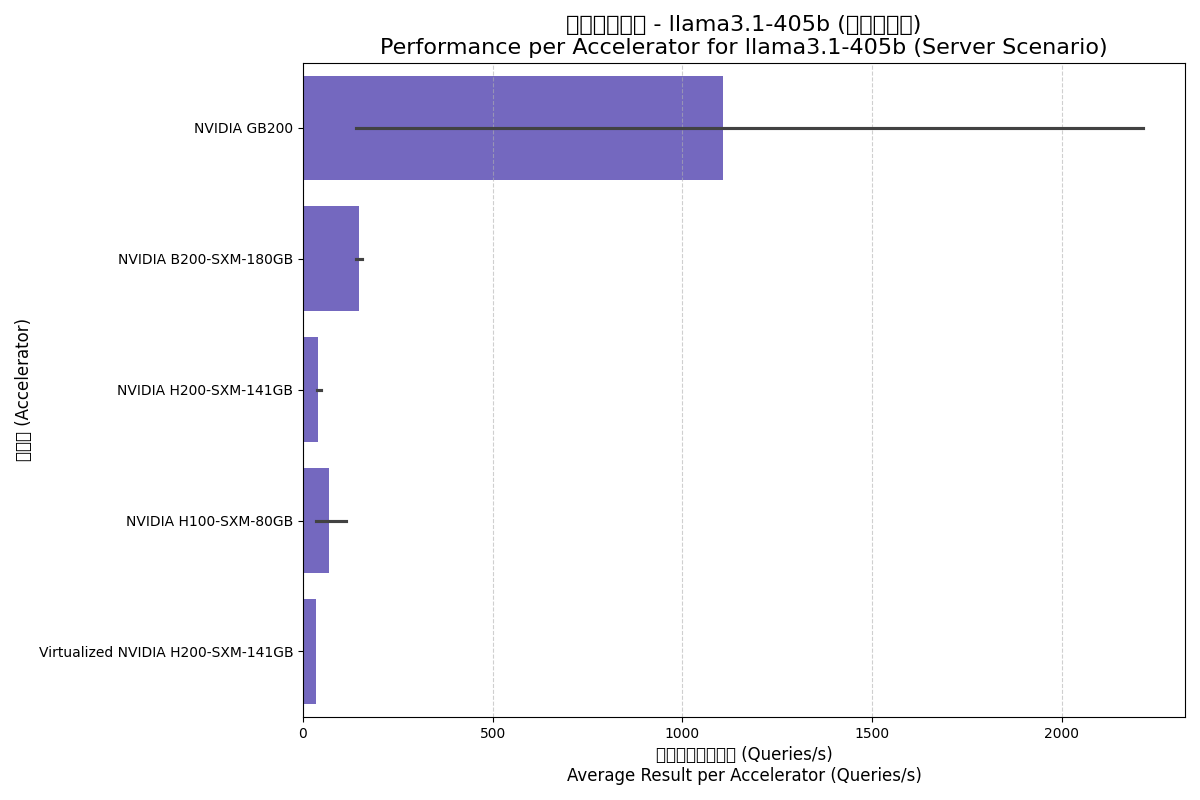
Analysis Insights:
- GB200 Built for Giants: GB200 shows its power in handling ultra-large models through massive cluster scaling.
- Memory Bottlenecks: Interestingly, H200 showed lower per-accelerator performance here than H100, likely due to H100 tests using more GPUs for tensor parallelism while H200 used fewer, creating communication bottlenecks.
- Blackwell Success: B200 yields a 2x generational leap over H100 for this ultra-large model.
5. Conclusion
- Generational evolution is the key driver: Blackwell (B200, GB200) sets a new benchmark for AI performance.
- The "Bucket Effect": Compute, Memory, and Interconnects:
- For large models, memory bandwidth is often the primary bottleneck.
- When models exceed single-node capacity, high-speed interconnects (NVLink) and topology become critical, as seen in GB200's results.
- Product Positioning: Data center flagships (B200, H200 SXM) are the choices for cutting-edge AI, while PCIe versions suit mid-scale tasks.
- Virtualization is Mature: GPU virtualization offers minimal overhead for AI inference deployment.
Choosing AI hardware is a multi-dimensional decision. This report aims to support those decisions with quantitative data from MLCommons benchmarks.