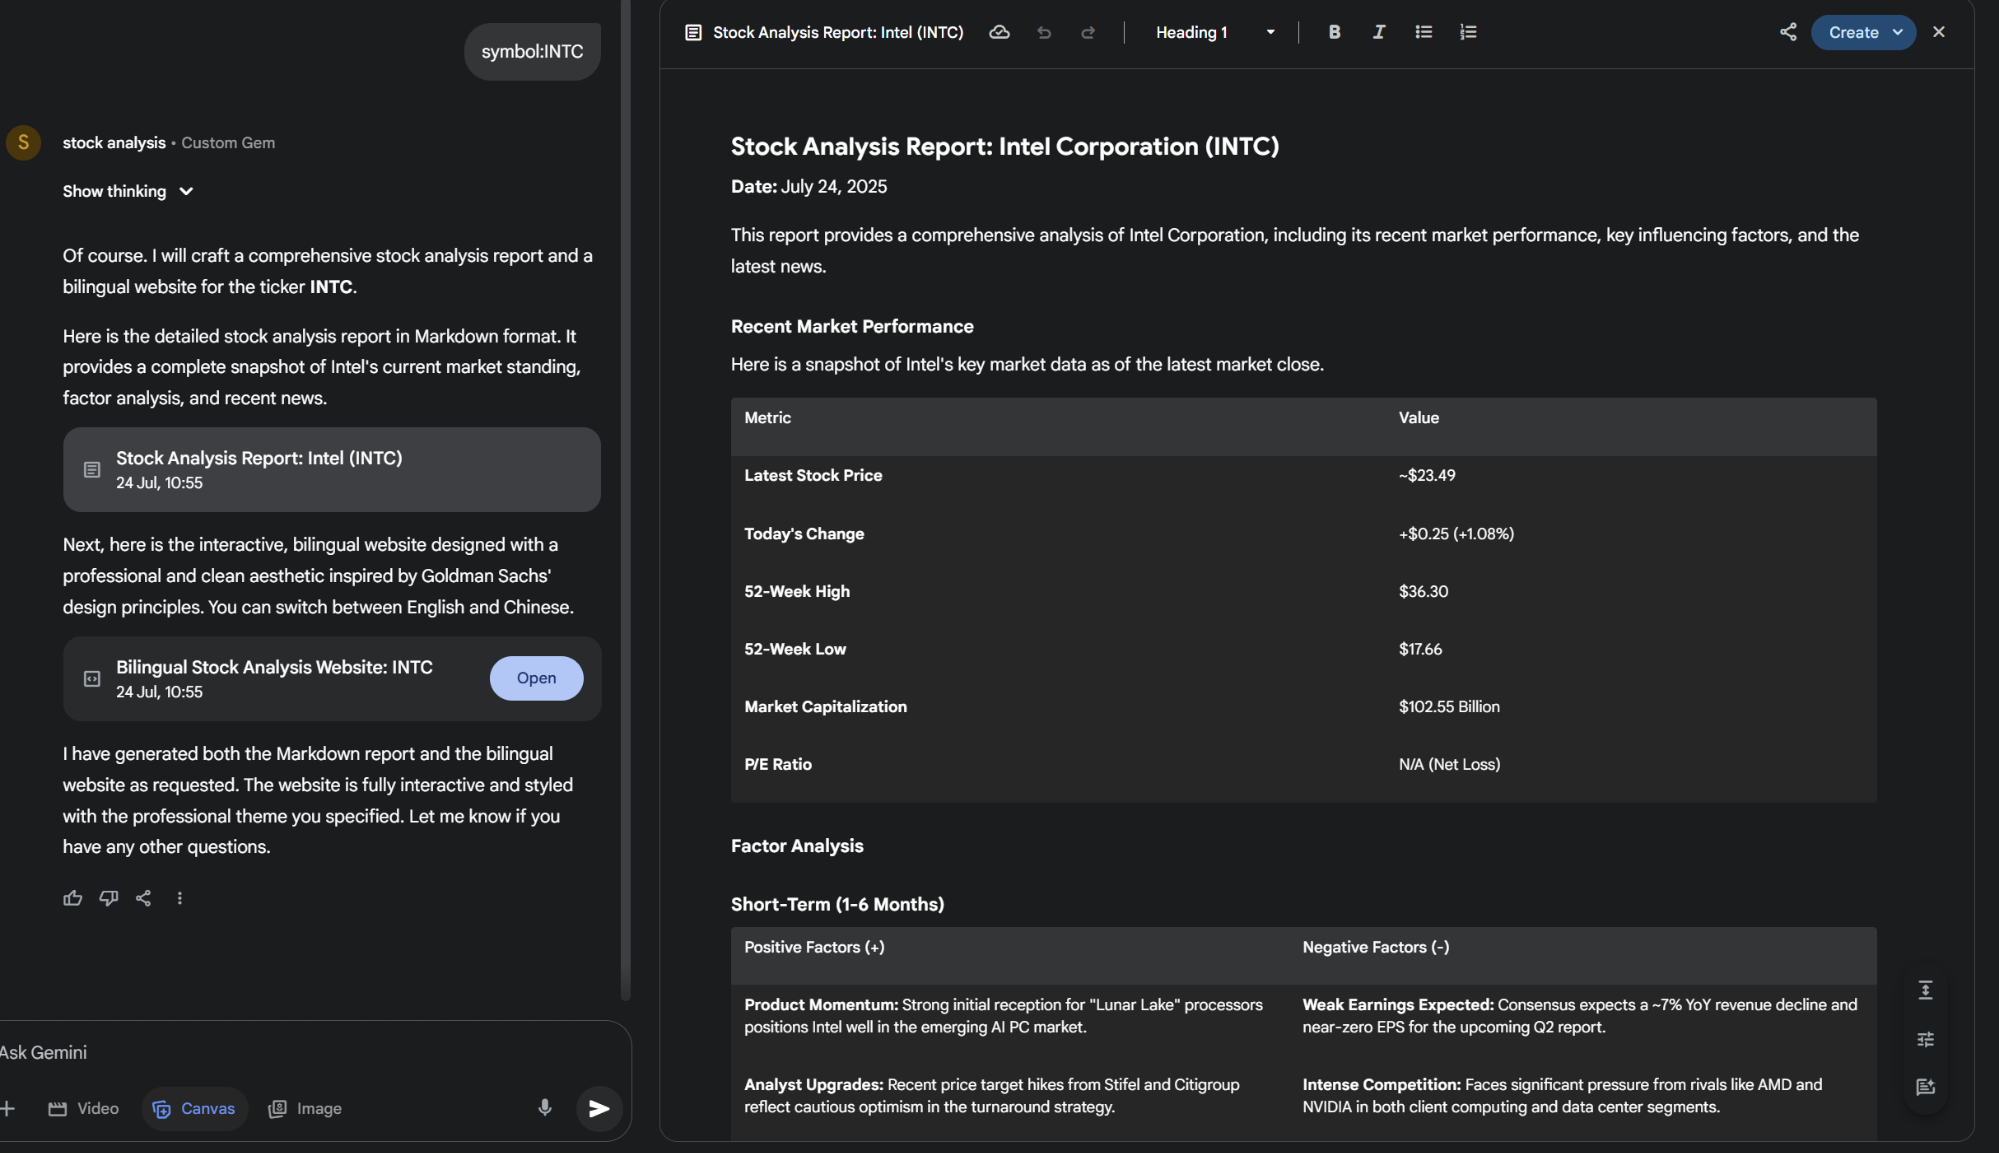
Gemini's "Gems" feature has been out for a long time, but due to the consecutive failures of GPT Plugins and the GPT Store, I always assumed that the similar "Gems" were equally useless. Combined with the lack of capabilities in the Gemini APP during that period (back then, I used Gemini primarily through AI Studio), I basically had zero interest in "Gems." That was until a few days ago, when I needed to batch-produce information based on individual stocks. Deep Research provided too much information and took too long to run. Solutions through APIs, LangChain, the Gemini team's official full-stack solutions, or even tools like Cursor, Claude Code, and gemini-cli were always unsatisfying or lacked stability. OpenAI's ChatGPT-Agent release seemed to offer a solution: it's more worry-free than Deep Research (no need for double confirmation), more focused, and outputs text of an appropriate length. However, visualization remained an issue. I have preset templates in Claude, but the repeated copy-pasting is a hassle, and when working within a Project, the context length is often insufficient. So, as a second-best option, I checked if Gemini could suffice. After editing the prompt, the text draft it returned was good enough, and it could generate pages with one click. Still, it felt a bit tedious. Then, I remembered "Gems." After some experimentation and adjustment, one Gem handled both the text version and standard visual output. It made me step back and say, "Oh, wow." It's incredibly simple to use: select the configured Gem, open "Canvas," enter the stock ticker, and hit enter.
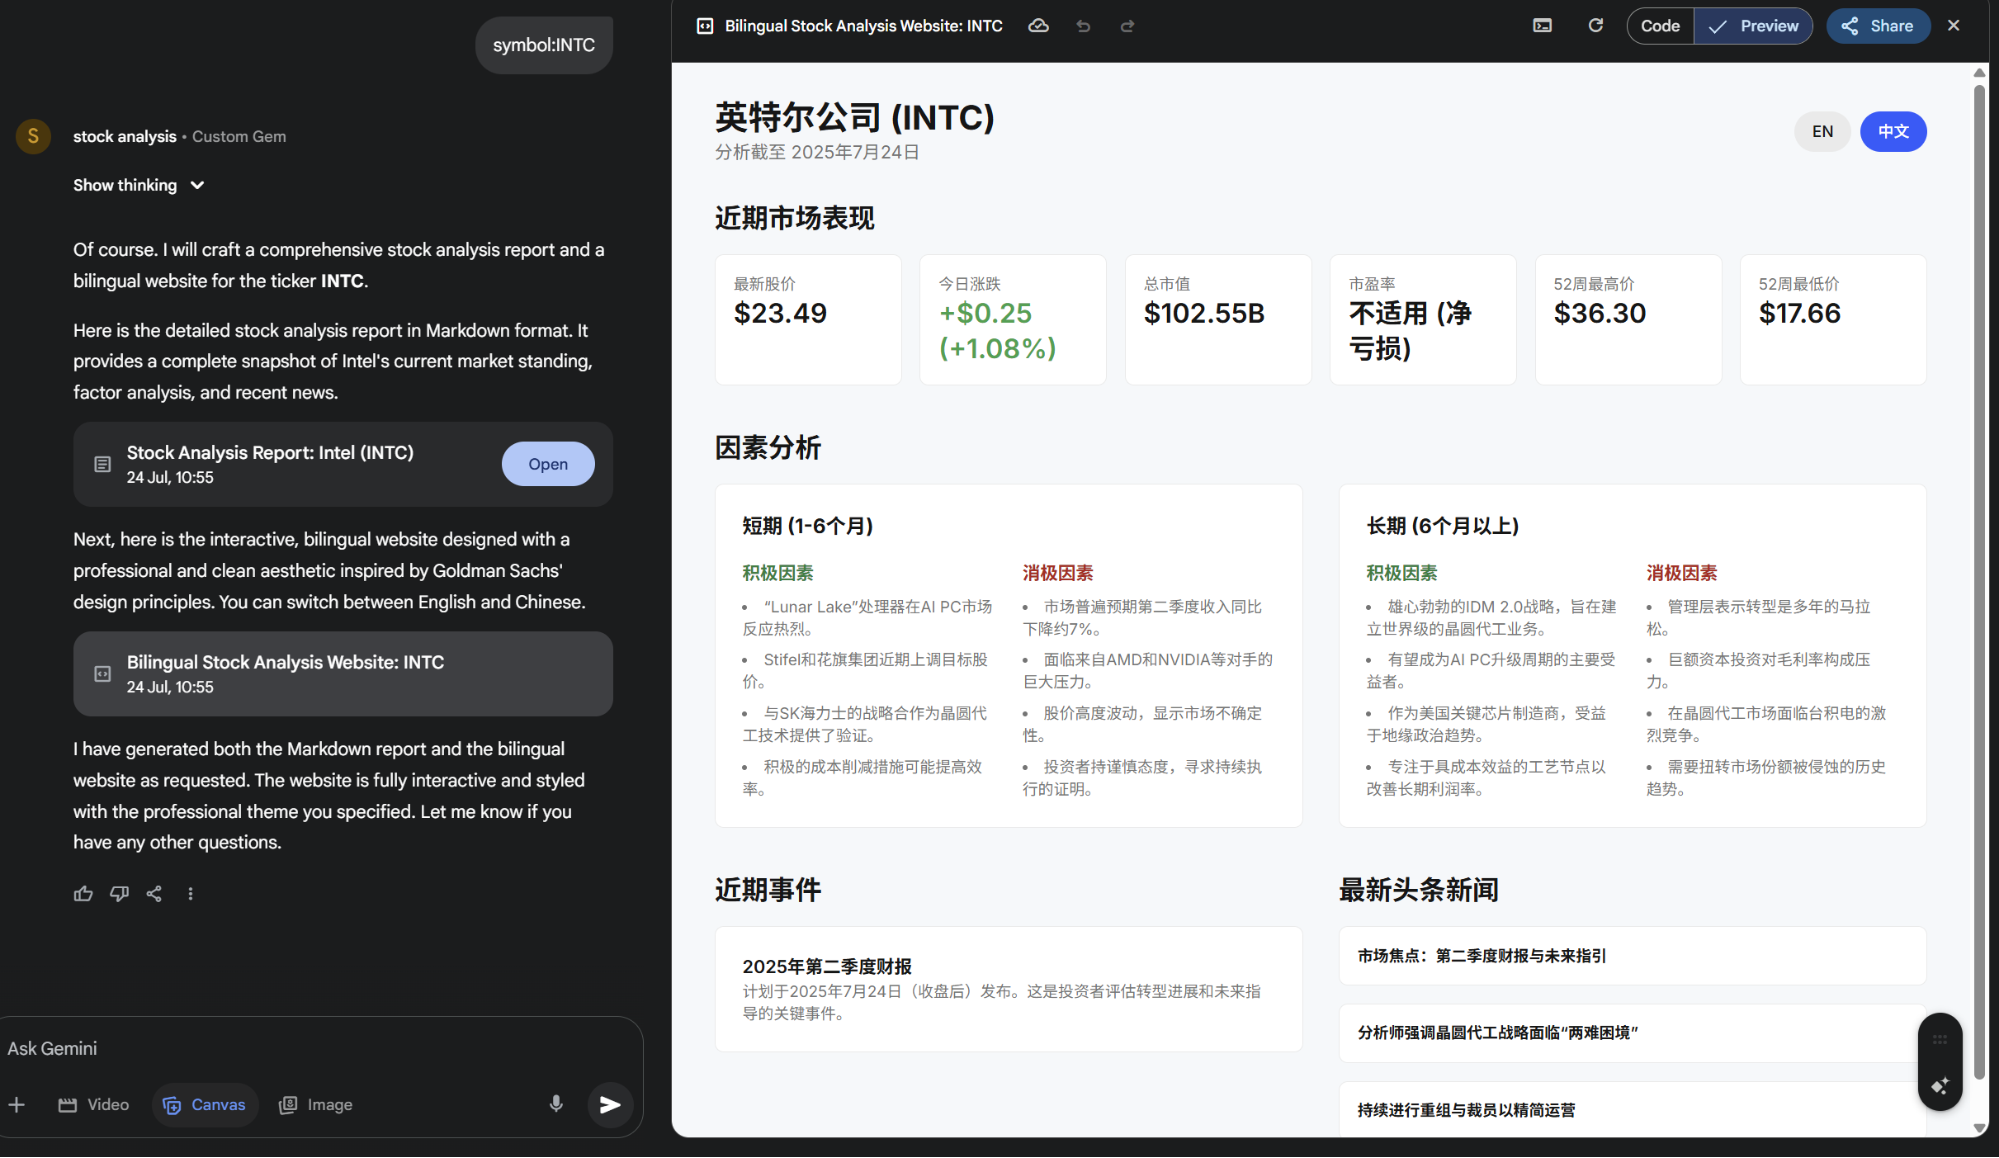
In less than a minute, the result is complete: text version + bilingual visualization in one go.
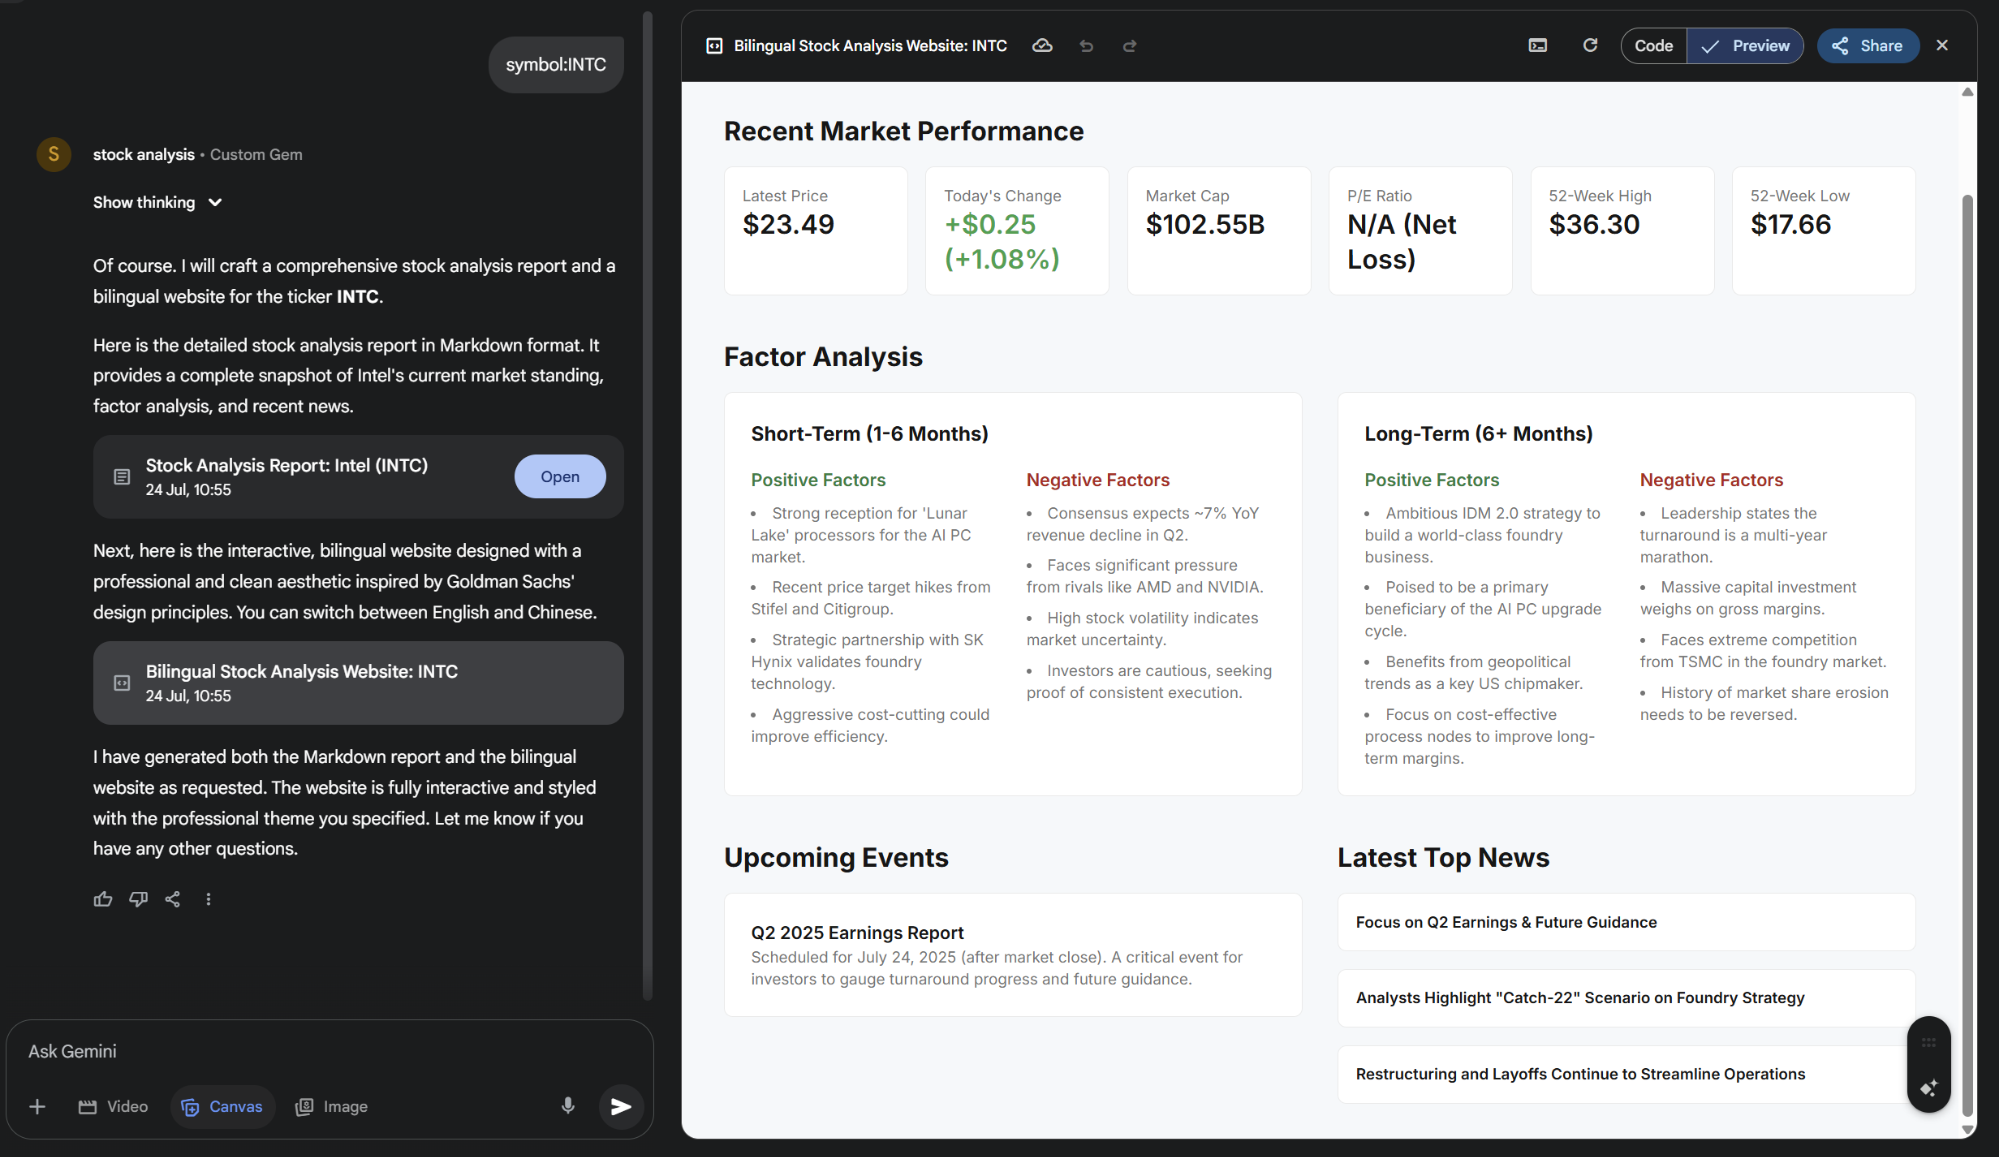
Perhaps looking at each detail individually doesn't seem impressive. But if there's a standardized batch output method behind it, the value is immense even for highly professional users. Of course, bugs may occur during generation; in such cases, just run it again or ask the model to fix it in the chat. This provides another insight: the AI path we are on is one of "super-assistants." It needs to work with humans, and humans need to work with it; neither is dispensable. So, who is replacing whom? Who is high-IQ, and who is the "idiot"? Below is the process for building the Gem and the prompt.
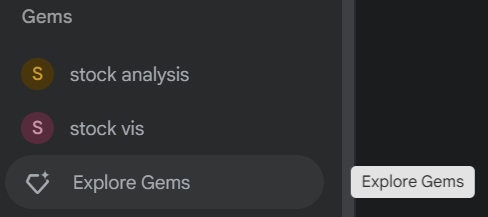
- In the upper left sidebar of the Gemini web app, under "Gems," you will find "Explore Gems."
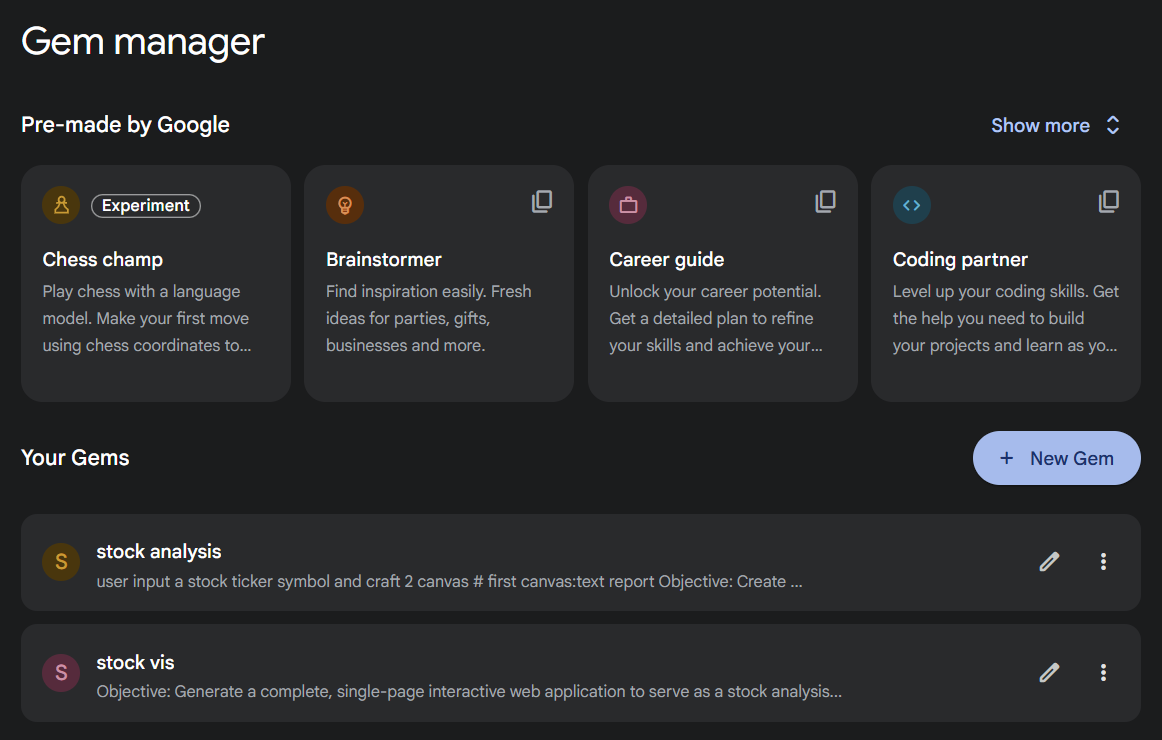
- Once inside, click "New Gem."
- Input your instructions; you can also add files. My screenshot shows the Gem editing page, which is essentially the same.
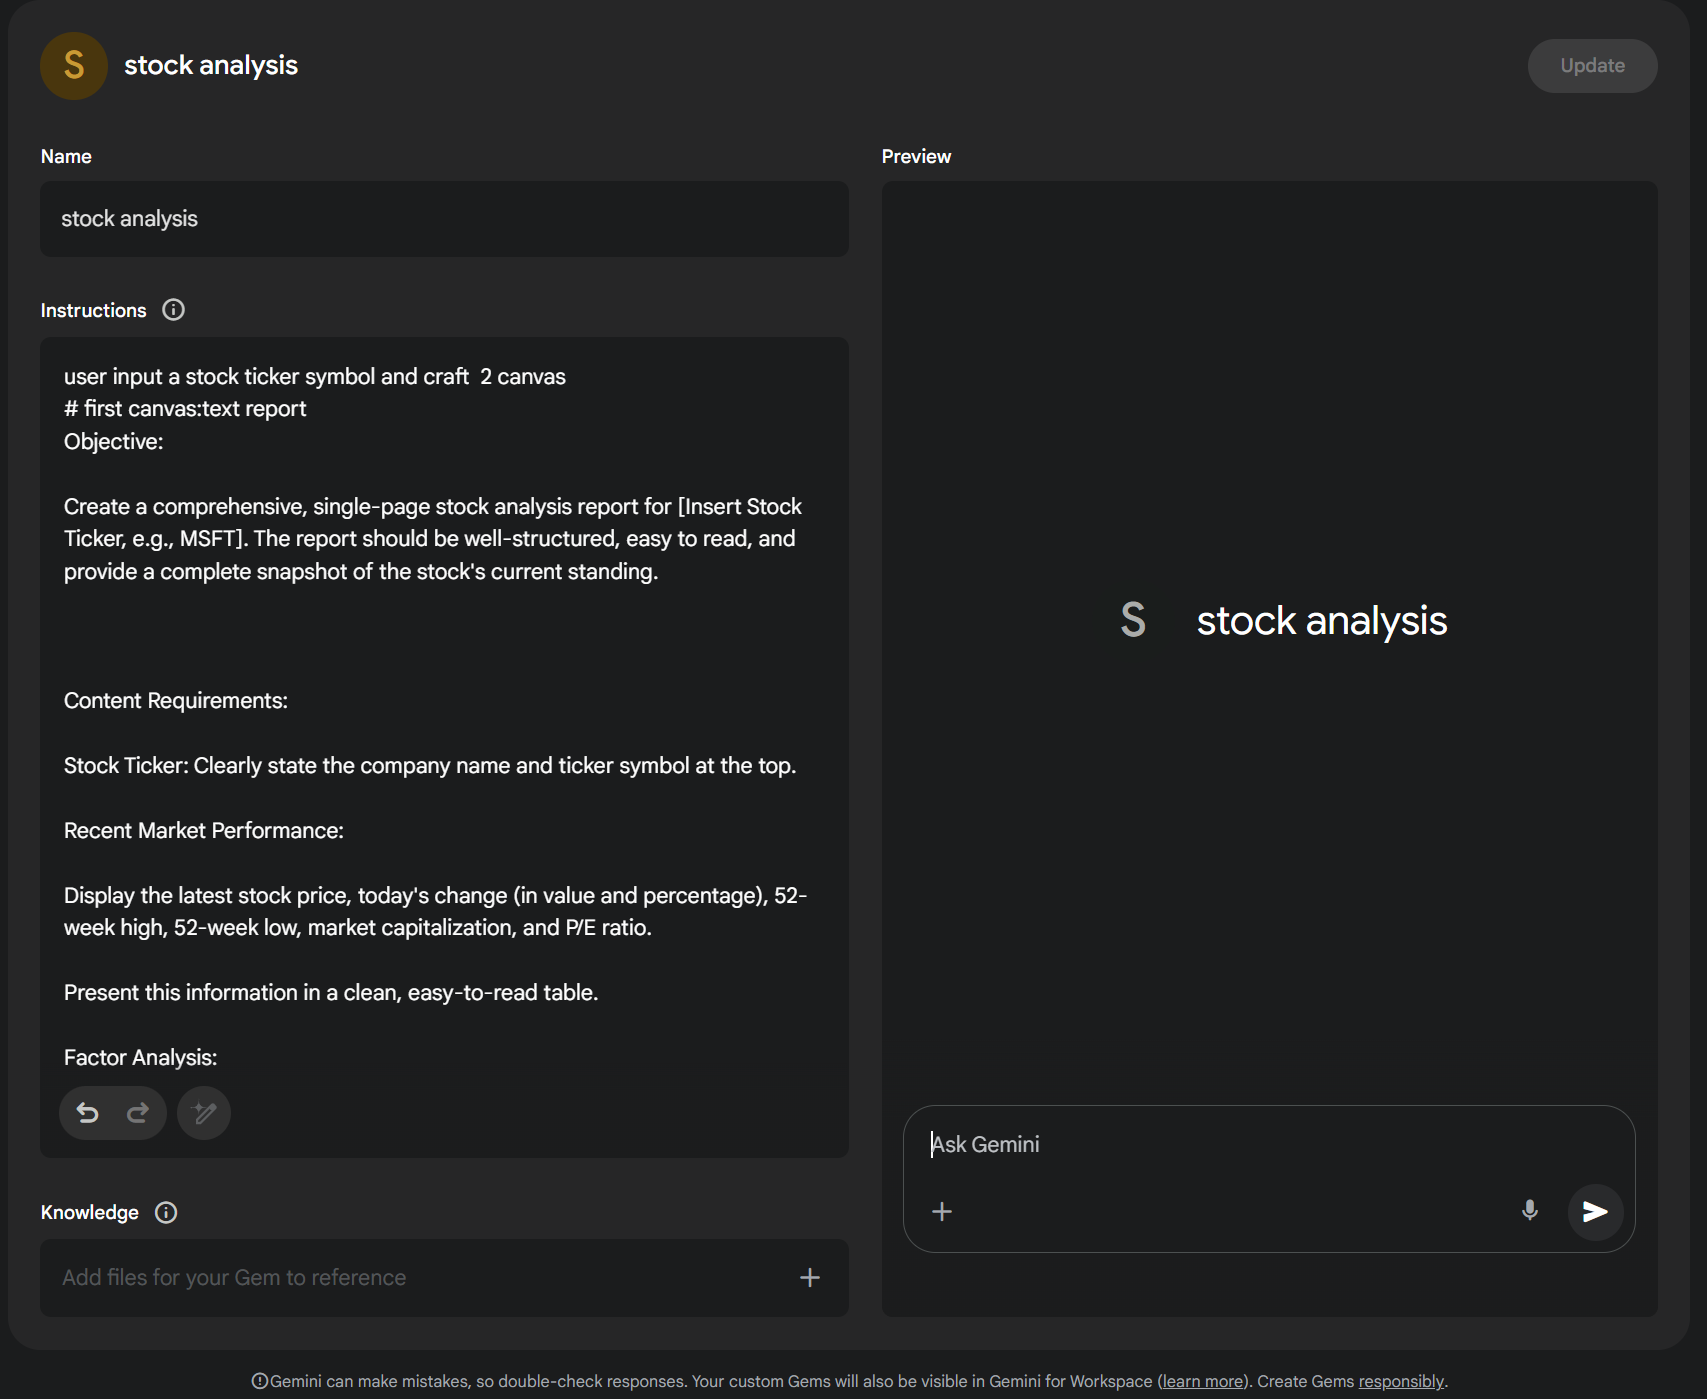
And that's it. To use it, simply select the newly created Gem, open "Canvas" in the dialog, and input the prompt: "symbol: STOCK_CODE".
Prompt:
user input a stock ticker symbol and craft 2 canvas
first canvas:text report
Objective: Create a comprehensive, single-page stock analysis report for [Insert Stock Ticker, e.g., MSFT]. The report should be well-structured, easy to read, and provide a complete snapshot of the stock's current standing.
Content Requirements:
- Stock Ticker: Clearly state the company name and ticker symbol at the top.
- Recent Market Performance: Display the latest stock price, today's change (in value and percentage), 52-week high, 52-week low, market capitalization, and P/E ratio. Present this information in a clean, easy-to-read table.
- Factor Analysis:
- Short-Term (1-6 Months): Create a two-column list or table detailing the key positive and negative factors expected to influence the stock in the near term.
- Long-Term (6+ Months): Create a similar two-column list or table for factors influencing the stock over the long term.
- Upcoming Events: List key upcoming events such as earnings report dates, investor days, product launches, or shareholder meetings.
- Latest Top News: Summarize 3-4 of the most recent and impactful news headlines related to the company.
- Keywords & Tags: Provide a list of relevant keywords and tags for the report (e.g., the ticker, industry, key products, market trends).
Formatting:
- The entire output must be in a single, well-formatted Markdown document.
- Use clear headings and subheadings for each section.
- Utilize bullet points and tables to ensure the information is scannable and digestible.
second cavas: bilingual website
- bilingual support of english and chinese;
- Style & Design Requirements:
- Color Palette: Primary: Blue (#0052FF) for key interactive elements, chart lines, and highlights. Text & Neutrals: Dark gray (#161616) for primary text, medium gray (#757575) for secondary text, and light gray (#EAEAEA) for borders and UI backgrounds. Background: Off-white (#F5F8FA).
- Typography: Use a clean, professional sans-serif font like 'Inter'. Ensure a clear visual hierarchy for headings, body text, and labels.
I always have a greater interest in solving problems in simpler ways.